Part I
In other end user machine environments, accuracy may seen less important. There may be less concern if readings aren't exact, as long as there's enough usable product to keep the boss off their back. Only if they're lucky, is that likely.
These days, increased competition and government regulations have boosted the demands for improved operating efficiency, business unit accountability, cost leadership, and quality certifications. The accuracy of measurement and control systems is of greater concern. Extensive applications of computers, data collection facilities, and databases are relying on accurate measurements.
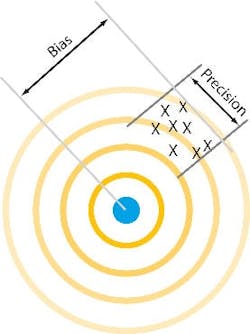
The shift of the bullet holes from the bull's-eye is the bias error and the tightness of the bullet pattern is the precision.When an OEM provides a system to accurately measure all the control variables, from web thickness to milled dimensions to chamber temperature, it helps the end user eliminate waste, improve efficiencies, and reduce costs.
Businesses are putting stricter accountabilities at lower levels in business units, and that requires accurate internal accountability for the unit as well as for intercompany or intracompany transfer.
ISO9000 certification is of increasing importance in the process and discrete industries, and instrument accuracy is an important part of that. The government is putting more and more regulation on the process industry, in particular, requiring more accurate measurement and data collection.
So accuracy is important. But what is accuracy? The language of accuracy is not universal, and any discussion depends on a common understanding of terminology. (For definitions of commonly used terms, see "An Accurate Glossary")
Absolute Accuracy or 'Repeatability'?
By definition, all accuracy is relative: how accurate a measurement is compared to a standard.
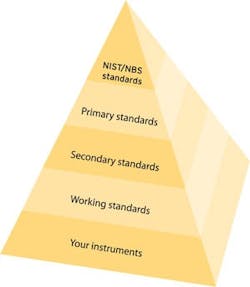
When discussing the error of an instrument or system, we need to determine what form of accuracy we need for a particular function. Absolute accuracy refers to how close a measurement is in relation to a traceable standard (see the traceability pyramid in Figure 2).
If it is important that you make a measurement in reference to an absolute value, we are talking about absolute accuracy. When most people talk about accuracy, they are talking about absolute accuracy. In order to have absolute accuracy for your measurement, you must have traceability from your measuring device to the National Institute of Standards and Technology (NIST)/National Bureau of Standards (NBS) reference standards (the "golden rulers"). The accuracy of your measurements is directly dependent on the accuracy of your calibrators, which is directly related to the care and feeding of your calibrators, the calibrator's calibration cycle, and the traceability of your calibrators.
In a plant where ambient and process conditions can vary substantially from a reference condition, the OEM needs to understand how the end user will attempt to maintain accuracy, and this can be a daunting task to simulate. Calibration cycle and methods, instrument location, instrument selection, maintenance, recordkeeping, and training all become important issues in maintaining instrument accuracy. A formal calibration program is the only way to ensure accuracy of instrumentation. This is essential for achieving and maintaining an ISO 9000 certification.
In days past, and probably today in some plants, it was not uncommon for an operator to control a flow to so many "roots" or some other variable to so many divisions. Here the concern is how repeatable the measurement is—if we are controlling to seven roots today, we want seven roots tomorrow to be the same thing. We want the instrument to provide the same value each time for the same process and operating conditions.
Many controllers that have relatively crude setpoints, such as pneumatic controllers and HVAC thermostats, specify "repeatability." The object is to maintain an acceptable setpoint, with little concern about the absolute value.
More critical applications such as laboratories and research facilities often use calibration curves. The accu-racy of measurement or control is related to a particular reading, which is then translated to an absolute accuracy value using a calibration curve. For this type of measurement, we are again talking about repeatability. For devices where influence errors are minimized and the drift error is controlled by the calibration cycle, this method can reach a higher level of accuracy.
Error Specifications
Manufacturers specify error limits for an instrument. These are not the actual errors that a particular instrument will have, but rather, the limits of the error that the instrument could have. On an individual basis, a given instrument may be able to be calibrated to a higher accuracy than its specification, and a group of the same instruments will fall within the error specification.
If a manufacturer states an error specification, it is generally true to within the vendor's testing methodology. The user should question any manufacturer who does not give an error specification. You may find that there is a good reason the specification was left off.
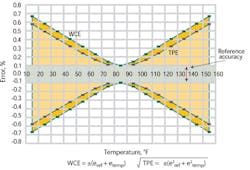
But manufacturers do not typically give just one error specification. Instead, they give multiple specifications and sometimes in different ways. This is because the error will typically vary when ambient and process conditions vary from the reference conditions where the instrument is calibrated, and the different error specifications allow the user to determine the probable error at other conditions. So in reality, these error specifications define an error envelope. An example of the error vs. ambient temperature envelope for a generic transmitter is given in Figure 3.
Not All Errors Are Created Equal
Errors are specified in a number of different ways. In order to compare and combine error specifications, they must all be of the same type. Some of the typical error specifications are:
± 0.2% of calibrated span including the combined effects of linearity, hysteresis, and repeatability;
± 0.2% of upper range limit (URL) six months from calibration;
± 0.1% of calibrated span or upper range value (URV), whichever is greater;
± 0.5% of span per 100° F change;
± 0.75% of reading;
± 1° F;
± 1/2 count; and
± 1 least significant digit (LSD).
Transmitter reference accuracy is typically rated in percent of span or URV while primary measuring elements, such as turbine meters and thermocouples, are rated in percent of reading or actual measurement error. For a transducer that is connected to a thermocouple, the error specifications are not the same—the former is typically in percent of span or URV while the latter is in percent of reading. In order to combine these errors, they must be the same type.
Digital device errors are usually resolution errors which are related to conversion errors, roundoff errors, and numerical precision. For example, a 12-bit resolution input device resolves the signal into 0-4,095 counts. It cannot resolve to less than 1/2 count out of 4,095 counts.
Roundoff error occurs when a digital device rounds off a partial bit value: G bit, H bit, etc. These errors can also be specified in terms of the least significant bit (LSB). For digital displays, errors are typically stated in terms of least significant digit or in percent of reading.
Precision errors involve the kind of math that is being done: single precision vs. double precision, integer vs. floating point math, etc.
Actual Errors
The error stated in the error specifications represents the limits of the error, not necessarily the error that the device will exhibit in the field. Actual error can be determined by testing the instrument in use and under process ambient conditions.
Testing a single instrument does not provide sufficient data to characterize a group of the instruments, but there are statistical methods that can be used when a small group of instruments are tested to estimate the accuracy of the instrument in general.5 This can be particularly useful in comparing manufacturers.
The actual errors determined during calibration can be compared to prior calibrations for the same instrument to measure the need to service or replace the instrument or to change the calibration cycle. This is becoming much more practical with the advent of calibration management systems that can easily retain the calibration history of an instrument.
Part II
"Accuracy is more than instruments error specs. Combine all error sources before you determine what you really need."
One of the less pleasant experiences for the unwary OEM equipment specifier is finding out an expensive instrument doesn't give readings accurate enough to control the customer's process. For the person whose signature is at the bottom of the design specification, the prospect of going to the boss and asking for a better replacement is, at best, embarrassing.
Two-Component System
The errors of individual components must be combines to get the total
system error. Simply adding the errors will understimate the system accuracy.
In some cases, the inadequate instrument stays on the job, giving readings no one really believes. At worst, the existence of a problem is either undiscovered or denied, and the instrument becomes a source of trouble that can range from variations in product quality to unexplained equipment malfunctions and shutdowns.
Instrument vendors are not a lot of help. They typically advertise their instruments in terms of reference accuracy. But when you look further, you find that the manufacturer has provided a multitude of error specifications to cover the range of process and environmental conditions where the instrument might be used. These errors can be significant and must be evaluated before the full story of the instrument's accuracy can be determined.
For example, a 0.05% reference accuracy over a given range might be qualified by an ambient temperature of 20 ± 2° C, at 50% relative humidity, and within 90 days of calibration. To know the accuracy rating a year later at 28° C and 90% RH, it is necessary to combine the errors from these different conditions.
So the savvy specifier, given the error specifications or actual errors for an instrument or system, needs to know how to combine them for an overall accuracy number. This number can then be used to compare instruments, do proration calculations, determine sensitivity, analyze systems, and so on.
Individual Instrument Accuracy
Calculating worst-case error (WCE), where all the errors in an instrument or system are added up in the worst possible way, gives a large error number. Field tests on instrument systems have shown that the actual errors are considerably less than the worst-case errors. It also has been determined that these errors are statistically random, which means they can be combined using the root sum square method (RSS).
For example, for a generic differential transmitter:
BASE CONDITIONS:
Temperature : 75° F
Static pressure: 0 psid (pounds per square inch differential)
Δ P : 100 in. WC (inches of water column)
OPERATING CONDITIONS:
Ambient temperature: 25-125° F
Static pressure : 500 psi
TRANSMITTER SPECS:
Calibrated span = 100 in. WC
Upper range limit (URL) = 250 in. WC
Reference accuracy = ±0.1% of calibrated span (including the effects of hysteresis, linearity, and repeatability)
Temperature zero/span shift error = ±(0.25% of URL + 0.25% of calibrated span) per 100° F.
Static pressure zero shift error = ±0.25% of URL per 2,000 psi
Static pressure span shift error = ±0.25% of span per 1,000 psi
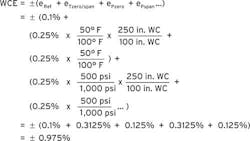
The worst-case error for this differential pressure transmitter is:
But since individual instrument accuracy specifications are considered statistically random, they can be combined using a root sum square calculation. According to such a calculation, the total probable error (TPE) for this differential pressure transmitter is:
We can see that in this case, the total probable error is about 57% of the worst case error.
Instrument System Accuracy Calculations
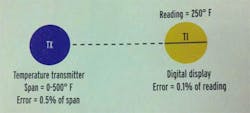
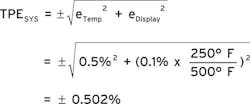
It also is possible to calculate the total probable error for a system that contains several instruments. If no calculations are required, the RSS method can be used to combine the errors of the individual instruments. You must ensure that all the errors are specified in the same manner. For example, for the system shown in Figure 1, the total probable system error (TPESYS) is estimated by:
Notice that since the temperature transmitter error is in percent of span (0-500° F) and the display error is in percent of reading, the display accuracy must be converted to a percent of span error number before it can be used in the error calculation.
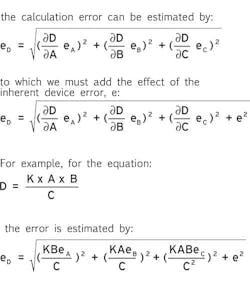
If instrument errors must first be calculated, the total probable error calculation is more complex because input errors are now added, subtracted, multiplied, divided, square rooted, etc. The effects of the these mathematical operations must be taken into account in addition to any inherent error in the calculation device. The calculation error can be determined using a Taylor series expansion. For the general case:
D = f (A,B,C)
K, in this case, is a published or derived factor, normalization factor, correction, or adjustment appropriate to the functional relationship being examined. This also assumes that there is not any uncertainty associated with the K factor.
Calculations involving constants that have an uncertainty associated with them must consider the effect of the uncertainty in the calculation. There also is a treatment of sensitivity calculations, which can be used to determine the effect of a given error or uncertainty in a calculation.
In order to make the error calculation for a calculating device, the errors must be stated in the same manner (usually in percent of span) and the signals must be normalized (range from 0-1.0). Also, note that the error analysis must consider the operating ranges of all the input variables involved so that the worst-case variable values will be used in the error calculation—for example, the larger the variables on the top of an equation and the smaller the variables on the bottom, the larger the calculated error.
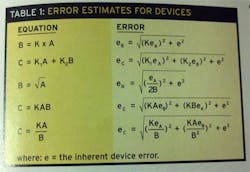
"The Application of Statistical Methods in Evaluating the Accuracy of Analog Instruments and Systems," by C.S. Zalkind and F.G. Shinskey, The Foxoboro Co., is an excellent paper on this subject and provides error estimates for a number of calculation devices. Some of the more common ones are listed in Table I.
How Accurate?
How accurate must an instrument be? The question reeks of compromise. Intuitively, your customers want the most accurate instrument they can get. But raising accuracy to the status of a holy grail is the perogative of philosophers and perhaps research scientists, for whom the questions of cost and reliability are piffling trifles. Engineers have the responsibility of choosing the lowest-cost, easiest-to-maintain equipment that will get the job done.
But how accurate does the system have to be? The accuracy of the measuring system should be higher than the required measurement accuracy. But how much higher?
One way to understand the impact of instrument accuracy is to consider instrument calibration. Just as instruments should be more accurate than the required measurement accuracy, calibration equipment must be more accurate than the instruments to be calibrated.
In industry, a common rule-of-thumb accuracy requirement for calibration is three to four times (3-4X) more accurate than the instrument performance specification. Other sources give other ratios—you can find 2X, 5X, 10X, 3-10X, 4-10X, or other guidelines.
Where do these numbers come from? The root sum square (RSS) equation, which takes the square root of the sum of the squares of the errors, shows the reasoning:
where:
TPE = Total probable error,
e1 = Error contributed by the measuring instrument or system, and
e2 = Error contributed by the calibration device.
If we rewrite the calibration device error in terms of the measuring system:
where:
e = Error contributed by the measuring instrument or system, and
X = Ratio of the error of the measuring instrument or system to the calibration device error.
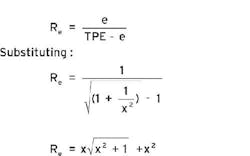
Now let's define the ratio of the error effect, Re, to be:
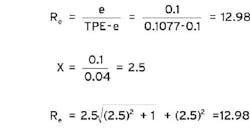
For example, consider an instrument calibrated for 0-100 in. WC that has an accuracy of 0.1% of span. Using a calibrator with accuracy 0.04% of reading:
The error contribution of the calibrator is 0.0077%. The error effect ratio is:
The Re for some common values of X are shown in Table II:
From this one can see that for an X value slightly greater than 2X (2.182, to be exact), the effect on the base accuracy is 10:1 or an order of magnitude. For 3-4X the effect is about 18:1 to 32:1, and for about 7X (7.053) the effect is 100, or two orders of magnitude. Extending this to a more general accuracy requirement, the minimum X is a little more than 2, 3-4X should be adequate for most things, 5X is appropriate for higher accuracy requirements, and 7-10X or more should be used for very high accuracy.
However, the practical use of this information for installed instruments calibration may be somewhat limited.
Modern field electronic instrumentation reference accuracy is typically in the 0.1% range with transmitters coming on the market in the 0.03-0.08% accuracy range. Many of the field calibrators on the market have accuracy ratings in the 0.02-0.08% of reading range and deadweight testers are in the range of 0.01-0.05% of reading.
From this information, it is not hard to see that getting past 3X for some instruments might be rather difficult and costly.
In evaluating the selection of instruments for measurement and control functions based on accuracy considerations, we must determine what we consider to be a significant effect on the overall system. For example, if a control specification is ±0.2° F and we choose an instrument whose estimated error contribution is an order of magnitude less than the spec (Re = 2.2), then we would expect the probable error contribution by the instrument to be 0.02° F. If this is not considered a significant contribution, then the instrument's accuracy is acceptable.
We must also remember that we are typically talking about systems that contain a number of components, each of which can contribute to the overall system error. Component errors must be added as described earlier. The system accuracy must also be evaluated for the expected operating range as outlined in Part 1. Then Table II can be used to help select instruments that will keep the system accuracy within the engineering requirements.
References:
- "Process Instrumentation Terminology," ISA-S51.1 1993, Instrument Society of America.
- Measurement Uncertainty Handbook, Dr. R.B. Abernethy et al. & J.W. Thompson, ISA 1980.
- "Is That Measurement Valid?," Robert F. Hart & Marilyn Hart, Chemical Processing, October 1988.
- "What Transducer Performance Specs Really Mean," Richard E. Tasker, Sensors, November 1988.
- "Performance Testing and Analysis of Differential Pressure and Gauge Pressure Transmitters," Lyle E. Lofgren, ISA 1986.
- "Calibration: Heart of Flowmeter Accuracy," Steve Hope, P.E., Intech, April 1994.

Leaders relevant to this article:

