Across the Great Divide?
We're in Year FIVE of our annual study that asks the Control Design audience how it researches, specifies and buys machine automation products and services. With an array of non-traditional, Internet-enabled methods—some effective, some less so—to choose from, we want to learn whether the tools of the trade are changing significantly for these tasks, so we can pass along as many peer lessons learned and best practices as we can.
We also try to use what we learn here to get a better sense of how to present content that helps you do your job. It has brought out issues that some companies in the supplier community reacted to and addressed to try to better serve your needs.
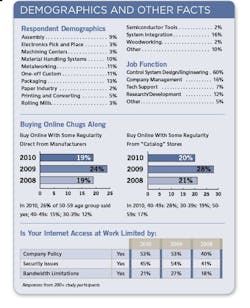
This time, we've done some additional data parsing to see if there are any significant differences in responses based on the age group with which the participants aligned. We wondered whether this would show up in affinities for Web-based content delivery.
Not Exactly 'Til Death Do Us Part
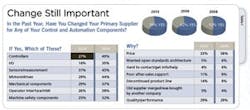
For several years, we've asked the study participants about the stability of their supplier relationships. This was a surprising finding in '08 with 52% saying they'd changed primary suppliers for one or more product categories in the past 12 months. In '09, it was higher with 62% of respondents saying they'd changed a primary supplier in at least one product category.
Age and industry experience differences were noted in these answers. The three biggest age groups among the participants were the 30-39s, the 40-49s and the 50-59s. Seventy-five percent of the 30-39 and 40-49 age groups said they've changed at least one major component supplier. The 50-59 group reported a 62% rate. The 30-39 year-olds were more active in changing motor/drive suppliers; the 40-49 group identified sensors and measurement; the 50-59 group mentioned controllers most often.
Keep Friends Close
This year we also asked about affinity for suppliers' user group conferences. Surprisingly, only 1% of the respondents said it's their primary method, and only 5% said it's their second-most-used method for doing product research. We expected a higher interest level.
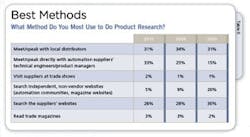
There were age group differences to note here. The 30-39 age group split its primary method vote between direct vendor contact and searching supplier websites, as both were selected by 31%. Meeting with local channel was primary to 27% of this group.
Some 41% of the 40-49 age group went with local distributors as their primary, while 35% preferred direct contact and 20% said supplier websites.
The 50-59 age group had the highest percentage (36%) whose primary method is to search vendor websites, with 34% favoring direct supplier meetings.
Overall, the percent of respondents who say their primary research source is visiting the Web, either to vendor sites or independent, third-party sites, stands at 31%, down from the 45% in '06 and '07 and 37% last year. As we'll see below, they're not running to Google or other global search engines as an obvious alternative, so our future studies will have to explore the above-noted increase in direct contact with supplier experts. Previous studies noted respondent frustration with trying to do that, so perhaps the mechanisms have improved.
Search Engines Still Rev
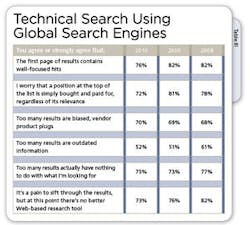
Of our respondents who do their primary product and specification research on the Web, the starting point more often than not still is Google if they don't have a particular vendor/brand in mind. The Google trend has been stable at 59% this year, 58% last year and 60% in '08. Having peaked at the 68% we found in 2006, and the overall website visit decline noted above, it seems to reinforce the notion of more specifiers returning to distributors and direct conversation with supplier experts. That's less the case with the 40-49 group, in which 44% named Google, compared with 73% for the 30-39s and 70% for the 50-59s.
But this year 75% still agree that too many results have nothing to do with what they actually are looking for. That compares with 73% last year and 77% in '08.
As a continuing "barometer of happiness" for this activity, this year 73% agree or strongly agree "it's a pain to sift through the results, but at this point there's no better Web-based research tool for me." That's an improvement over 76% in '09 and 82% in '08.
The 40-49 group expressed the least amount of trust in global search, registering the highest levels of concern about content bias, off-target results and rankings integrity.
Vendor Site Visits
Perhaps indicative of the supplier churn noted above, the typical number of vendor websites that our group visits to make adequate comparisons increased again. Some 41% say they need to visit two or three supplier sites, but 44% now need four to six sites. In '09, 53% said they only needed two-to-three vendor sites, with 36% needing between four and six. In '07, those numbers were 44% and 38%.
We ask our audience what they think makes for a good vendor website. Within the wide range of comments based on the respondents' actual experiences, several issues show up more than others. The basics don't change: be easy to navigate, have easy-to-find specs and include real technical details—not teasers, downloadable product manuals, schematics and similar references.
This year, in line with the noted 33% who changed suppliers based on price, there was more mention of the need to find price lists that are both accurate and available without having to call or provide visitor information. There also were more comments this year decrying supplier websites that seem to go out of their way to avoid providing a phone number to call. "If I have to fill out forms, I leave the site," would summarize a frequent comment.
"Number one is complete and pertinent technical support documentation online," says Karl Wangkay, mechanical design engineer, Lionapex Equipment in the Philippines. "Second is pricing immediately shown and no need to RFQ. Omega is a good example of that. Usually the bad sites require you to contact them first for the info and pricing, and usually they point you to local distributors who don't know jack about the products technically and take a week at best to provide a quote. In our business, we need to release quotes as soon as possible to clients, and delays due to absence of the two are critical in landing a job."
"Be specific" is another common theme. "I need concrete descriptions of offerings without fuzzy market speak," says Choy-Hsien Lin, process optimization engineer at Stora Enso. "Give me clear comparisons between different [product] variants."
Most, but hardly all, respondents don't like to register in order to dig deeper. Some say that's a deal breaker for them.
Decision-Making Criteria
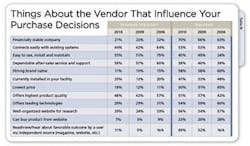
Our group valued various vendor characteristics that influence or don't influence their purchasing decisions (Table IV). Factors most often identified as extremely important continue to be no surprise: "dependable after-sales service and support" was considered extremely important by 59% of respondents (57% last year), with 39% (40% last year) considering it important. "Easy to use, install, and maintain" maxed out at 55% and 45% (51% and 49% in '09).
Paper? Plastic? Neither?
Our ongoing chicken-or-egg conundrum involves helping you find valuable online information delivered in "containers" other than traditional magazine and website-posted articles.
If we think of ourselves as useful content providers, then we have to try to evaluate and anticipate trends for newer and emerging methods of information delivery. Sometimes, we'll push stuff at you and gauge reaction, and in cases such as this survey, we ask you to tell us directly.
So for a few years now we've been trying to determine the value you place on information-delivery methods such as webinars, video, podcast/MP3 downloads, online forums and blogs, and whether you use any of them to help you do your job (Table V).
Forums/bulletin boards returned to '08 levels, as 14% said they use them weekly and 36% use them monthly, compared to 10%/31% in '09 and 14%/41% in ‘08. They still, however, garnered the most positive comments from responders.
Reflecting the sentiments of many in this study: "Forums collect user experiences," says T.J. McDermott, senior project engineer at Formost Fuji. "It's a great 'free' support tool that I'm surprised suppliers don't use more often."
As was the case in prior years, a handful of respondents said they found the forums useful because they occasionally come across performance or support issues the vendors would prefer they didn't know about.
Again this year, only 5% say they use webcasts weekly in job-related activities and about 23% say they dabble monthly. If there's any sign here that webcasts might ever gain traction, the number who say they don't even use the medium socially declined to 19% from last year's 27%.
Positive comments about webcasts again focused on their value as employee training and product use explanations. Most prefer on-demand availability. Criticism was similar to prior studies. Many objected to the length of webcasts and that too many are product-focused without the substance to justify the time involved.
Blogs and twitter feeds remain decidedly low-valued. In 2009, not one of study respondents said they frequent blogs weekly. This time 3% said they did. Monthly interest was 14%, down from 15% last year. A telling 47% said they have no use for them socially either. That's up from 41% last year.
Age and Digital Media
We figured we'd better sort these digital media findings by age group to see if, as often is the case in social media, younger participants might indicate more likelihood they're using these methods for their jobs. It's a decidedly mixed result, but no dramatic generational gaps define the groups.
For webcasts, the 50s group likes webcasts best. Eight percent of them frequent webcasts weekly and 29% use them monthly. The 30s group was 5%/23% and the 40s group was 3%/15%.
Forums and bulletin boards attracted a younger crowd. The 30s and 40s groups were roughly the same with 15% using them weekly and 45% monthly. The 50s group numbers were 9% and 31%.
It's largely the same valuation of blogs and twitter across all ages. Five percent of the 30s crowd visit them weekly and 19% monthly. For the 40s group it's 3%/15%, while the 50s respondents came in at 2%/13%. In this case, the 50s crowd actually claimed the most social, non-job use at 20% of respondents, while the 30s claimed 14% and the 40s came in at 9%.


