Delta Computer Systems Motion control software with XY plotting
Nov. 27, 2017
Related To:
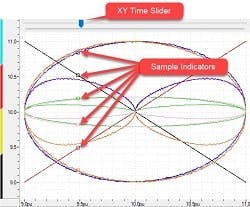
The RMCTools motion control software features XY plotting in addition to plotting variables over time. The tool can produce stress-strain curves and can be used to compare valve flow versus command signal to check whether a valve is within spec. It can analyze actuator position versus temperature or can be used to characterize hysteresis by observing variation in control-variable behavior increases versus decreases. An XY plot displays all the data items in a plot relative to any other data item in the plot, with that other data item being the horizontal (x) axis, and the remaining data items being plotted on the vertical (y) axis.

