In 2007 and 2008, we began to track their affinities for video, podcasts, blogs and other tools for doing product research. This year, we asked about newly emerging web-based tools as well.
[sidebar id="4"]In addition to letting you know the consensus product research tendencies of your peers, we also use what we learn to get a better idea of how to present content that helps you do your job. It also brings out issues that some companies in the supplier community address to try to better serve your needs.
Digital Tools DestinationsAs with many industry studies, longer-term changes can be more illustrative than year-to-year comparisons that probably include some misleading data spikes or dips in certain research-preference categories. We see there's been slowly growing affinity for use of some of the digital tool choice trends over the four years we've monitored them (Table I).
In 2008, 16% of respondents said they used webcasts occasionally. This year it's 29%—and that's a bump of 6 points compared with 2010, with the biggest support (44%) coming from the 30-39 year-old study participants. Although there's been no change in those who claim more frequent use than monthly, those who say you've never used webcasts for your job dropped to 5% compared with 26% in 2008. An open-ended question about which of these delivery vehicles provides the most help made it clear that the participants overwhelmingly prefer an on-demand webcast option. In addition, worries about the event being just a product fluff piece keep many of the respondents from trying them out.
Product videos and machine automation videos have a long way to go before they'll be considered a mainstream tool for this audience, but use at an occasional level has grown to more than one in three, compared with about one in seven in 2008.
The four-year trend for blogs remains mixed, and this year age-dependent. Although this group of respondents still makes little regular use of them, the group that says it uses blogs at least once or twice a year has grown to nearly 40% from 30% in 2008, mostly drawing recruits from the group that says they never use blogs for their jobs. The "never" group stands now at 11%, a significant change from a 29% group contribution in 2008. Only 6% of the 50-59ers use blogs occasionally or more, compared with 32% of 40-49ers and 42% of the 30-39ers.
Asked what they considered the best non-vendor website for their product research, most of the respondents couldn't name one, and defaulted back to Google. "I have not found one. No automation or control magazine would dare talk bad about a potential ad revenue generator or face legal battles," said one. "So it is nearly impossible to get the real facts in a Consumer Reports-like evaluation. Instead, you're left to forums where people's opinions are of little factual help." Another commenter said, "How is anything considered a non-vendor site when essentially vendor ads pay for all these sites?"
We've reached a critical-mass use point with these digital tools so we can begin to ask about more-specific use in future studies and draw some defendable conclusions.
This year, we asked about more-recently emerging social media as information delivery tools. Almost 80% of the respondents don't use Twitter for any purpose, and only 3% report occasional or more frequent use.
Facebook shows similar results, except three in 10 do say they have Facebook activities outside of their jobs. As more companies raise their visibility via Facebook, perhaps we'll see an increase in job-related activity moving forward more quickly than the other digital tool options have. It's only among the less-than-40-year-old respondents that we find any (12%) weekly job-related Facebook use.
"As an electrical and controls engineering consulting firm, social media allowed us to reach out to clients locally, and prospective clients outside our usual territory of the Pacific Northwest," responded Josh Sherman of Trindera Engineering, Coeur d'Alene, Idaho. "Our company shares current projects, services, presentations, photographs and fliers on Facebook, Twitter and LinkedIn. Followers view our posts and comment that they weren't aware Trindera worked on a certain project or provided a certain service, and new teaming arrangements are born."{pb}
LinkedIn users (at occasional use or better frequency) represent 18% of study respondents. Whether this represents more than "next job" networking remains to be seen, although the vehicle can present opportunities for a different flavor of discussion forums and bulletin boards.
We asked about the seemingly on-again, off-again offering of virtual trade shows. Although just one in 10 have only occasional use for them, another 40% say they use them once or twice a year, so we'll look for increased levels of interest in future studies.
Happier Supplier Relationships?Across the six years of the study, spanning good economic times and bad, we've asked about the volatility of study participants' supplier relationships. Each year, we learned that more than half of the responders changed its supplier for one or more primary automation component.
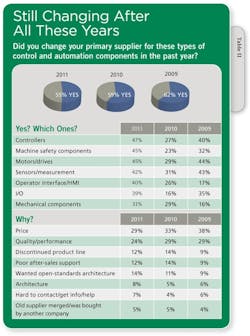
This year (Table II), we found what at first glance looks like more stability, even though a full 55% said they've made a change or changes in the past year. This is less churn than the 59% we found last year, and the troubling 62% from the 2009 study results.
But although fewer changed suppliers, those that did made changes in more product categories than last year, and comparable to the 2009 churn that was more price-related than anything else.
Some 72% of the 20-29 year-old group of participants say they changed a major supplier in the past 12 months, compared with 56% of the 30-39 year-olds and 52% of 50-59 year-olds. The 30-39ers and 50-59ers indicated they on average changed suppliers in 3+ product categories, while the 40-49ers averaged just over two product category supplier changes.
Price still is the biggest change agent, but it declined to 29% from 33% in 2010, and 38% in 2009, during the economic meltdown when cost-cutting pressures were even more rampant than usual. Poor quality/performance was noted by fewer (24%) responders than previously.
With some relief from the pricing pressure, we find upticks of poor after-sales support causing users to switch. Although only 14% of the respondents say they changed suppliers because of it, that's twice the rate of 2008. After price and quality/performance, 19% of the 40-49ers noted poor after-sales support as their reason to change suppliers, compared with only 7% of the 20-29ers and 9% of the 50-59ers.
Your Favorites
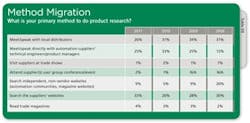
We ask the study participants about their primary method for doing product research (Table III). For the first time since we began this annual study, the use of vendor websites significantly outpolled the use of local distributors as the single most-preferred method. Meeting directly with the manufacturers' product experts took a significant dip, returning to 2009 levels, suggesting perhaps a spurious data spike in last year's result.
We saw some differences among the age groups for this question. Overall, 33% said searching supplier websites is their primary method. But 44% of the 30-39 year-old group noted that as their primary method, compared with 28% of the 40-49 year-old group and 37% of 50-59ers. Speaking/meeting with local distributors (26% overall) was the primary method of 44% of the 40-49ers, but only 24% of the 30-39ers and 19% of the 50-59ers said it was their primary method. That 37% website vote by the 50-59ers represented the biggest percentage within that age group.
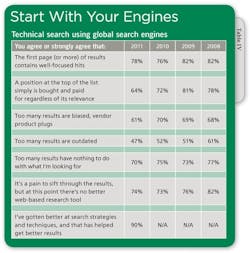
One reason for the overall better search experience is 90% of the respondents agree with the statement that they've gotten better at search strategies and techniques. Also, in 2008, 78% agreed that the results at the top of a search list were probably bought and paid for, regardless of relevance. This year, that sentiment is shared by only 64% of respondents.
What Makes a Supplier Site Good?
We received a lot of comments to open-ended questions, learning what makes for a useful website to do product research, and what makes a website bad.
Distilling them down makes it clear that many of the respondents would like easier, faster access to product pricing. "First, give me ready access to all pricing information, even if it is only a nominal list," answered John Raynes, owner of Raynes Engineering in Torrey, Utah. "I want to know within a minute or two if we're even in the ballpark before spending more time. Second, I want ready access to all relevant product information (datasheets, manuals, etc.) in PDF format."
Raynes also commented on what makes a site bad. "Don't make me register/login just to browse basic catalog information," he said. "I don't mind giving my name and simple contact info, but creating a login account when I don't know if I'll ever be back is just stupid." Another annoyance: "Elaborate, showy web animation that slows down the process of getting to the relevant information quickly."
About 15% of those responding to this question cited having to register as a negative, many calling it a reason to leave and not revisit the site.
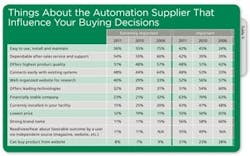
Many others said they're turned off by "too much marketing stuff before you can find the product info and specs." They also are wary of sites with unsubstantiated product performance claims.
About the Author
Joe Feeley
Editor in Chief

Leaders relevant to this article:


